-
Rarity Score 리뷰카테고리 없음 2023. 2. 7. 00:02
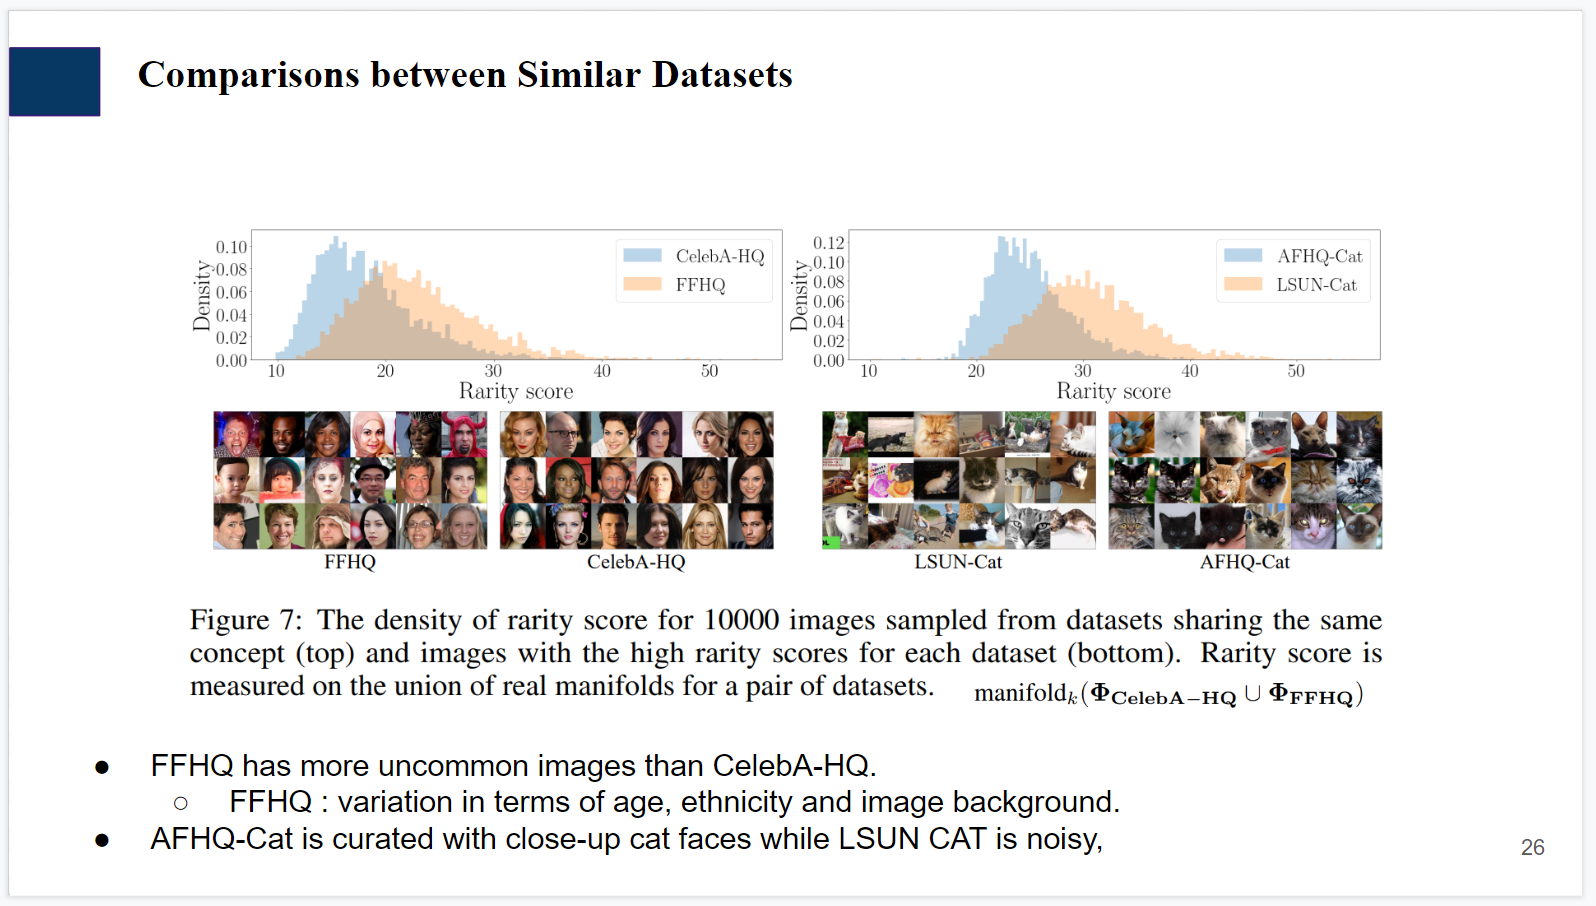
Rarity Score : A New Metric to Evaluate the Uncommonness of Synthesized Images 리뷰
link : https://arxiv.org/pdf/2206.08549.pdf

ICLR 2023 top 25% 를 받는 metric 논문.
Intro
본 논문은 individual 이미지의 "rariry" 측정을 시도한 최초의 논문. 해당 novelty에서 우수한 평가를 받은듯 하다.

Exisiting metric들은 how well generated (Real의 distribution을 얼마나 잘 따라감) 을 타겟팅하는 반면 본 논문은 generated에서 만든 샘플이 얼마나 rare 한가를 측정함.

rarity가 높을수록 typicial 하지 않은 레어한 이미지가 나온다. + nonsense인 이미지는 없다.
Main contribution 요약
- Classify whether individual image is typical or rare.
- Compare SOTA GAN’s creativity without losing fidelity.
- Proposed metric can be applied on top of the various feature spaces (e.g. CLIP, DINO ..)
Preliminary
Preliminaries
- Precision/Recall (Tuomas Kynkäänniemi, Tero Karras, Samuli Laine, Jaakko Lehtinen, and Timo Aila. Improved precision and recall metric for assessing generative models. In NeurIPS, 2019.)
- Density/Coverage (Muhammad Ferjad Naeem, Seong Joon Oh, Youngjung Uh, Yunjey Choi, and Jaejun Yoo. Reliable fidelity and diversity metrics for generative models. In ICML, 2020.)
- Realism score
(펼치면 prdc recap)
더보기
Precision : real의 manifold에 generated가 얼마나 속하는지 (generated의 fidelity 측정)
Recall : generated의 manifold에 real이 얼마나 속하는지 (real의 diversity 측정)

Density : Indicator를 G, R 에 모두 돌림. 즉 generated가 real의 hypersphere에 여러번 들어가는 경우도 중복으로 카운팅 허용, precision의 진화 버전.

Coverage : Real의 hypersphere에 한 번이라도 generated가 들어오면 카운팅. (recall 진화 버전)
(density와 달리 generated의 매니폴드 관점에서 측정함.. 만약 좋은 g라면 다양한 g 매니폴드에 generated samples들이 쏙쏙 박히므로 diversity가 좋을것.. 다시말해 coverage 굿일것)
(recall과 달리 real의 manifold만 구성하면 되므로 computational cost 감소)
Realism score is high when generated image looks real.
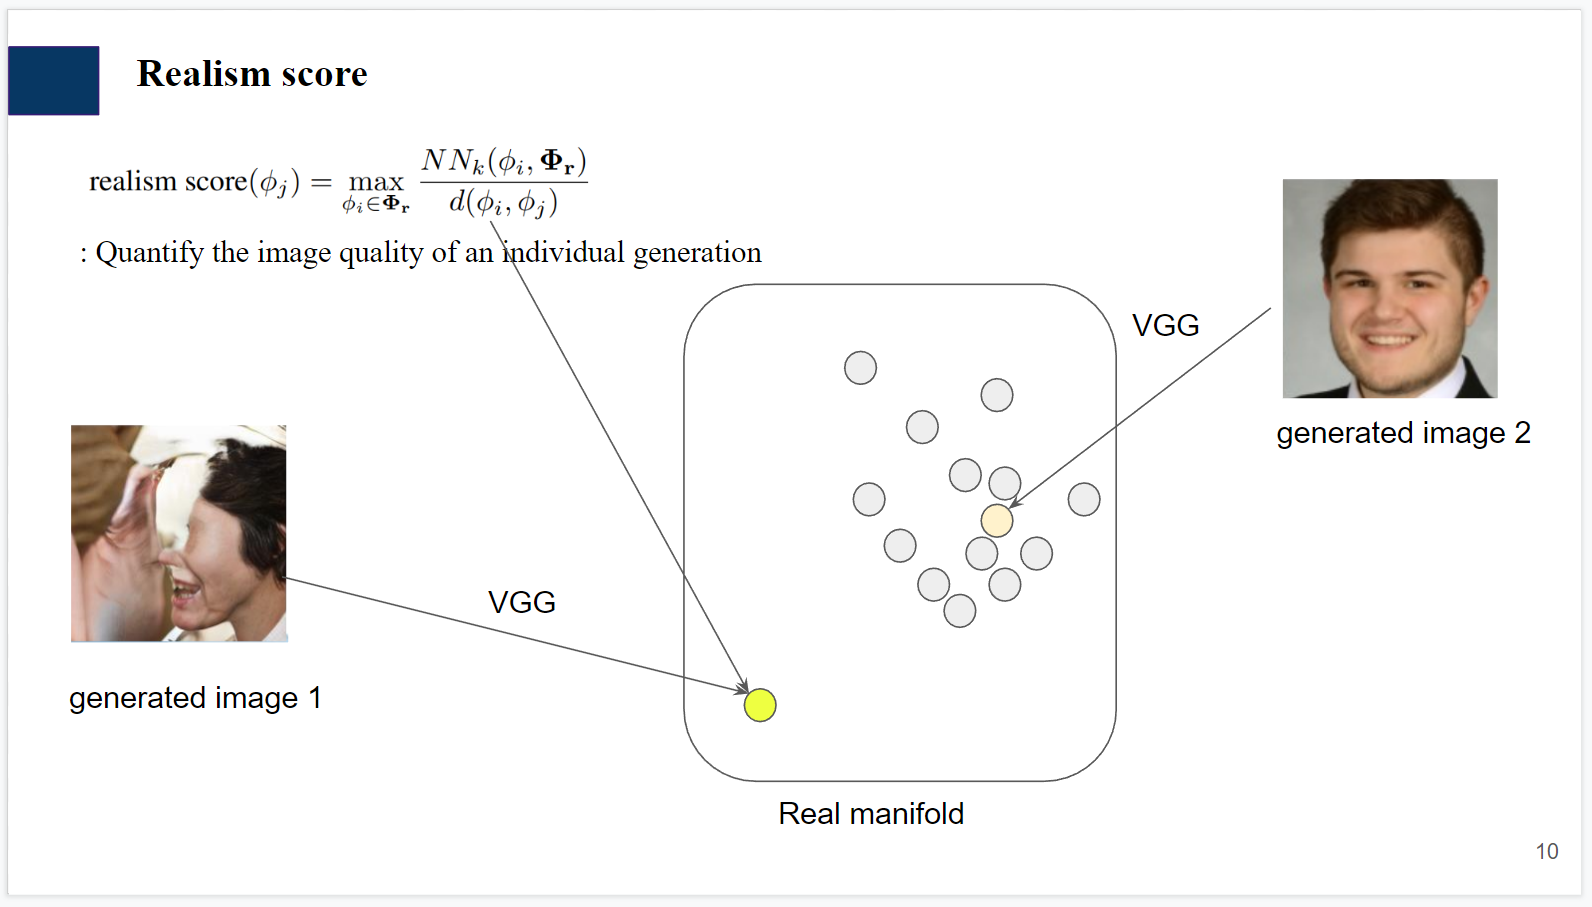
Generated1 을 임베딩하면 nearest real과의 distance↑, nearest neighbor의 radius↓ -> realism score 0.1
Generated2 을 임베딩하면 nearest real과의 distance↓, nearest neighbor의 radius soso -> realism score >>0.1
하지만 본 메트릭으론 이미지의 rare함을 측정하기엔 문제의 소지가 있음.
Countercase :
The effect of the radius is depressed by the effect of the distance between the real and the fake sample.
If the radius of the k-NN sphere is small when the distance between fake sample and a real sample is also very small,
Realism(=rarity) score would be large.직관적으로 이해가 안된다면, 뒤로 넘어가도 무방하다.
Rarity score

Real의 typical한 샘플들은, 고만고만한 오밀조밀한 manifold 공간에 모여있다에서 직관을 얻어 rarity score를 얻었다고 한다.

rarity score 수식 설명
Individual generated sample이 만약 real의 hypersphere들에 속한다면, 속했던 hypersphere 의 최소 radius가 곧 rarity score가 됨.
g2는 r2, r3의 hypersphere 모두에 속하지만, r2의 sphere의 반지름이 더 작으므로 해당 반지름 값이 rarity score가 될 것.
(직관적으로 r2 샘플 주변에 파란 점(real)들이 많은 걸 보아, mean latent 부근이라 추측됨.)

a : g1이 오직 r1의 boundary에만 갇혀있는 경우. (rarity score 높음. r1은 radius가 큰 unique one 이기에.)
b: rarity score skw음
c: 어느 sphere에도 들어가지 못하는 g3은, 취급하지 않는다. real이라고 볼 수 없는 artifact 이미지는 애초에 rare함 고려를 해버리지 않음.
The choice of K

Spearman 상관계수 이용, 적당한 K를 정한 합당성에 대한 부분.
(논문의 설명이 이해하기 쉽지 않았음. 오픈 리뷰에서 왜 이 부분은 이야기가 안나왔는지 모르겠다.)
빨간 부분부터 보자면, K=1 , 1~10의 상관계수를 비교한 부분이다. 비슷한 범위의 K와는 correlation이 높고, sparse해질수록 차이가 난다고 함.
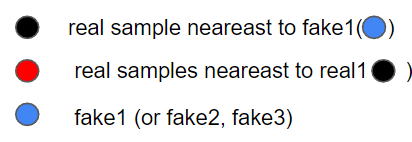

for example) (검은 점이 원 중앙에 있다고 생각하기.. 그림 잘 못 그렸음)
(fake들이 초록색 boundary안에서만 생성된다고 할 때), K=1, K=1의 correlation은 0이다.
K=1, K=2는 sphere 1의 두 번째 radius가 크므로 correlation이 이전 경우보다 떨어질것이다.
세 번째는 더 떨어질 것이다.
but correlation은 k=1 , k=2 k=3 에서 어느 정도 높게 유지될 것이고, k=10 이렇게 커지면 correlation이 작아질 것이다.

두 번째 그림 .. 이해하는데 상당히 오래걸렸다.
The second plot in Figure 3 shows the average rank correlation between k = 1 and 1 ≤ k′ ≤ 10. Each color indicates the target generations in Mi. Please note that Mi ⊂ Mj for i ≤ j and the rank correlation changes dramatically for the cases in Mj \ Mi.
요약 : k>i (generated sample 생성되는 범위 지정해줌) 에 대해 consistent.
각 선들이 manifold1(k=1 boundary), maniford2(k=2 boundary) 에 generated sample 생성됨을 의미.
case들을 하나하나 살펴보면,
case1. (좌하단 네모박스 부근 집중)
fake들은 M1, 즉 k=1(1st nearest) boundary 안에 생성됨.
k=1일 때 out of manifold 없음, 정확하게 radius 측정 가능.
따라서 k=1 과 k=1~10의 mean rank와 average rank correlation을 측정하면, 높은값 나올것. (네모박스 안의 점)
M1에 대해 k=2 과 k=1~10의 mean rank와 average rank correlation을 측정 역시 높을 값 나올것 (네모 박스 바로 오른쪽 점)
case2. (좌하단 네모박스 부근 집중)

(k=1, M2 일 때)
M2는 K=1의 boundary 밖에 생성됨.out of manifold가 두 sphere에 존재하고 rank를 정확하게 못만듦.
이 부정확한 rank와, k=1~10의 mean rank와 average rank correlation을 측정하면, 엄청 낮은 값 나올 것
case 3.

(M2, k=2 일 때)
generated가 다시 k의 boundary(초록색) 에 속하므로 out of manifold 없고, rank 정확한 값 나올것.
따라서 k=2 과 k=1~10의 mean rank와 average rank correlation을 측정하면, 높은값 나올것.
하지만 case 2가 k=1~10의 mean rank 값 구할때 트롤링 했기에 전체적인 correlation은 M1 보다 낮은 모습
이 case들의 반복이다.
i<k일 떄 correlation 이 consistent함. 에 집중하면 될듯함.
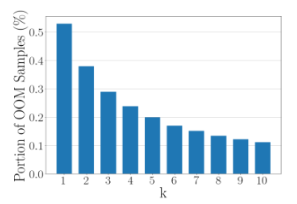
k=1,2로주면 OOM이 너무 많아진다. real의 manifold 구성하기엔 radius들이 너무 작아짐. Experiment


Conclusion
이 논문의 contribution
1. Can evaluate rarity of an individual image rather than a set of images.
2. Can be applied to compare between generative models or datasets in terms of the density of the rare samples.내 생각
My opinion
- Real 수가 적으면 모든 face공간을 span하지 못해서 rarity score도 부정확할텐데, 최소 샘플 수에 대한 실험 X
- OOM 고려 x < 샘플 적으면 문제소지 생길듯? (real 해보이는 샘플도 제외할듯한 느낌)
- rarity score 23점 <- 얼마나 높은건지 감 잡기 어려움 like FID